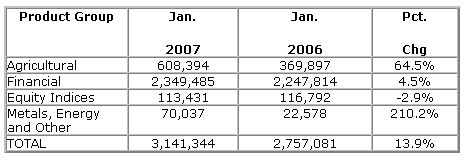
ADV in the CBOT Agricultural complex was 608,394 contracts in January, an increase of 64 percent compared with January 2006. Higher volume was fueled by increases on both the CBOT electronic trading platform and in the open auction environment. January’s electronic ADV for Agricultural futures was 238,488 contracts, 55 percent greater than December 2006. Meanwhile, open auction Agricultural ADV was 354,505 contracts, an increase of 2 percent compared with January 2006.
January’s record volume in Corn options-on-futures contracts contributed to the growth in overall Agricultural trading volume. In January, an average of 77,644 Corn options-on-futures contracts traded each day, three times greater than January of last year. Corn futures contracts also experienced significant volume growth in January, as ADV reached 246,026 contracts, up 97 percent over January of 2006.
Metals Complex
The CBOT Metals complex continues to post increasing volume – compared with both the prior year and the prior month. In January, ADV in the CBOT Metals complex was
69,914 contracts, three times greater than January 2006 and up 33 percent over December 2006. Notably, CBOT Full-sized (100 Oz) Gold futures saw ADV reach 53,116 contracts in January, an increase of 43 percent compared with December 2006 and three times greater than January 2006.
The CBOT Silver complex also experienced volume growth in January, as ADV was 9,923 contracts, three times greater than the same month last year.
Interest Rate Complex
January’s ADV in the CBOT Interest Rate complex was 2,349,485 contracts, an increase of 5 percent compared with January 2006. January volume for 10-year U.S. Treasury Note futures and 2-year U.S. Treasury Note futures contributed to the overall growth within the complex. January 2007 ADV for 10-year Treasury Note futures was 1,023,453 contracts, while ADV for 2-year Note futures was 137,741 contracts, increases of 19 percent and 34 percent, respectively, over January of 2006.
Electronic trading volume of Financial options contracts continued to grow in January, when an average of 82,036 Financial options were traded each day – a 60 percent increase compared with January 2006. In January 2007, 22 percent of all Financial options trades at the CBOT were executed electronically.
In July 2006, the Exchange launched its new Binary options contracts on the Target Federal Funds Rate. The event driven contracts are becoming increasingly accepted by market participants who seek to manage risk associated with the Federal Open Market Committee’s (FOMC) decisions regarding movement of the Target Federal Funds rate. January ADV for Binary options was three times greater than December 2006.
Equity Index Complex
ADV in the CBOT Equity Index complex was 113,431 in January, a decline of 3 percent compared with January of 2006.
CBOT Average Daily Volume

CBOT Rate Per Contract
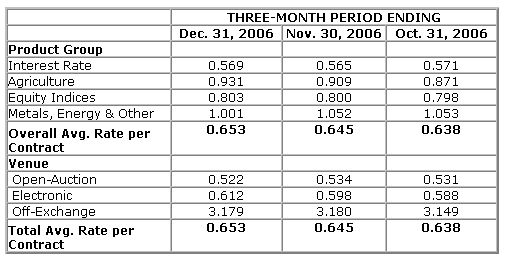
The following chart depicts the Exchange’s December 2006 three-month rolling average rate per contract (in dollars), and the two preceding three-month periods’ average rates per contract. Average rate per contract represents total exchange and clearing revenue divided by total reported trading volume. Average rates per contract can be affected by exchange and clearing fee price levels, and the customer, product, venue and transaction mix.


