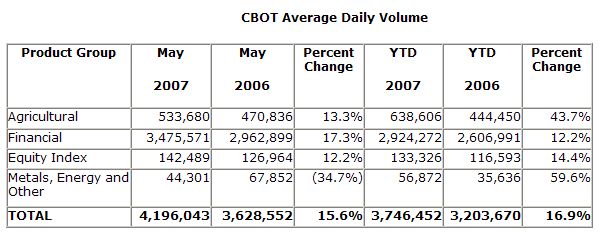
ADV on the Exchange’s e-cbot® electronic trading platform was 3,349,304 contracts in May 2007, a 31 percent increase compared with May 2006. Year-to-date, CBOT ADV is 3,746,452 contracts, up 17 percent over the same period in 2006.
Agricultural Complex
May’s ADV in the CBOT Agricultural complex was 533,680 contracts, 13 percent greater than May 2006. Increased electronic trading volume contributed to the higher volume totals in the Agricultural complex. In May, 51 percent of total CBOT Agricultural futures trading volume was conducted electronically. Year-to-date, Agricultural complex ADV is 638,606 contracts, an increase of 44 percent over the same period in 2006.
Agricultural trading activity in May led to notable volume increases in the Corn and Soybean product complexes. Corn futures averaged 205,451 contracts traded each day in May – an increase of 20 percent compared with May 2006. ADV in Corn options increased to
54,089 contracts, up 39 percent over the same month in the prior year. Soybean futures ADV was 95,784 contracts, 25 percent higher than May 2006. Soybean Oil (36,604 contracts) and Soybean Meal futures (36,316 contracts) also achieved ADV growth in May, amounting to increases of 17 percent and 12 percent, respectively, over May 2006.
Interest Rate Complex
Total volume in the CBOT Interest Rate complex reached a record 76,462,571 contracts in May, surpassing the previous record total, 69,820,880 contracts, set in March 2007. ADV in the Interest Rate complex was 3,475,571 contracts in May, an increase of 17 percent compared with May 2006. Year-to-date, ADV in the CBOT Interest Rate complex is 2,924,272 contracts, an increase of 12 percent over the same period in 2006.
The CBOT’s 2-year U.S. Treasury Note futures contracts achieved records for both ADV and total volume in May. ADV was 327,153 contracts in May, up 53 percent compared with May 2006. The previous ADV record for 2-year U.S. Treasury Note futures was 298,240 contracts, set in February 2007. The new total volume record for 2-year U.S. Treasury Note futures is 7,197,364 contracts, surpassing the previous record, 5,666,562 contracts, set in February 2007.
10-year U.S. Treasury Note futures also set a record for total volume during May, 34,343,898 contracts, surpassing the prior record of 30,367,167 contracts, set in February 2007. May’s ADV for 10-year U.S. Treasury Note futures was 1,561,086 contracts,
31 percent greater than the same month in 2006. With 712,429 contracts trading per day, 5-year U.S. Treasury note futures ADV increased by 21 percent compared with May 2006. Total volume for 5-year U.S. Treasury Note futures was a record 15,673,429 contracts in May 2007, exceeding the previous record of 14,410,185 contracts set in February 2007. While the Exchange’s 30-year U.S. Treasury Bond futures experienced a 2 percent increase in ADV when comparing May 2007 with the same month in 2006, 30-day Federal Fund futures experienced a 37 percent decline in ADV in May 2007 over May 2006.
ADV in the CBOT Interest Rate Swap complex was 3,935 contracts in May, an increase of 3,153 contracts over May 2006. Both the 5-year and 10-year Swap contracts experienced volume growth for the month, increasing by four times and ten times, respectively, compared with ADV from May 2006.
Electronic trading volume of financial options contracts was 89,840 contracts in May 2007 – a slight increase over ADV from May 2006. Year to date, an average of 85,827 financial options are traded each day on the e-cbot platform – up 33 percent compared with the same period in 2006. Meanwhile, the Exchange’s newest electronically-traded financial options contracts, its Binary options on the Target Federal Funds Rate, continued to experience ADV growth – up 16 percent compared with April 2007.
Metals Complex
ADV in the CBOT Metals complex was 44,130 contracts in May, a decline of 35 percent compared with May 2006. Year-to-date, ADV in the CBOT metals complex is 56,645 contracts, up 59 percent compared with the same period last year.
Equity Index Complex
ADV in the CBOT Equity Index complex was 142,489 contracts in May, an increase of 12 percent compared with May 2006. Year-to-date ADV in the CBOT Equity Index complex is 133,326 contracts, an increase of 14 percent compared with the same period in 2006. The Exchange’s $5 mini-sized Dow Jonessm futures contracts contributed to the success of the complex, as 134,361 contracts traded each day in May – up 15 percent over May 2006.

CBOT Rate Per Contract
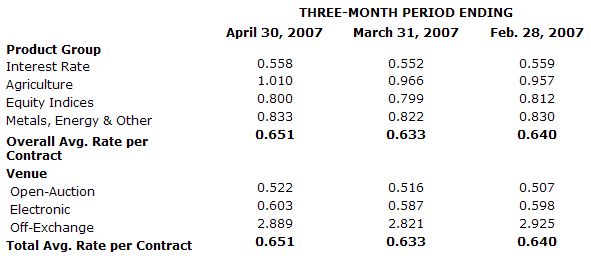
The following chart depicts the Exchange’s April 2007 three-month rolling average rate per contract (in dollars), and the two preceding three-month periods’ average rates per contract. Average rate per contract represents total exchange and clearing revenue divided by total reported trading volume. Average rates per contract can be affected by exchange and clearing fee price levels, and the customer, product, venue and transaction mix.


